Practice: Population Maps
Contents
Practice: Population Maps#
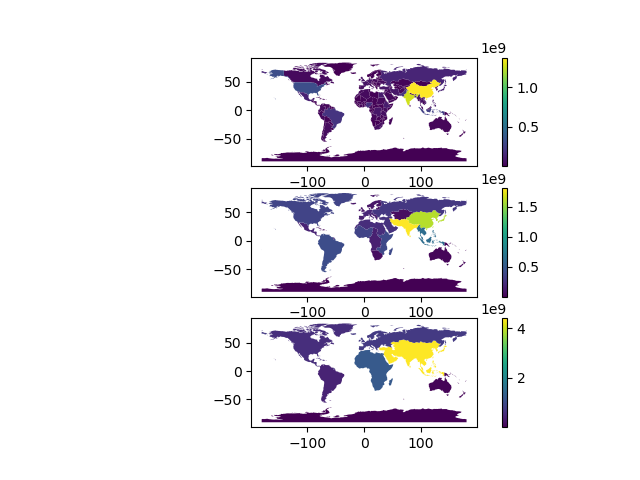
Write a program in main.py that reads in the world dataset and makes a plot containing three axes in one figure. The top-most plot should plot the population (column POP_EST ) by country (the original data format). The middle plot should plot the population aggregated by the sub-region (column SUBREGION ). The last plot should plot the population aggregated by the continent (column CONTINENT ).
The final result should look like the one below.
Implementation Details#
Read the data in from the file
geo_data/ne_110m_admin_0_countries.shpEach plot on each axis should have a legend.
Recall to save a figure, you can call
savefigon aFigureobject. You should save the visualization to a file namedpopulations.png.Your program should use the main-method pattern and should not define any global variables.