Practice: Small and Rich
Practice: Small and Rich#
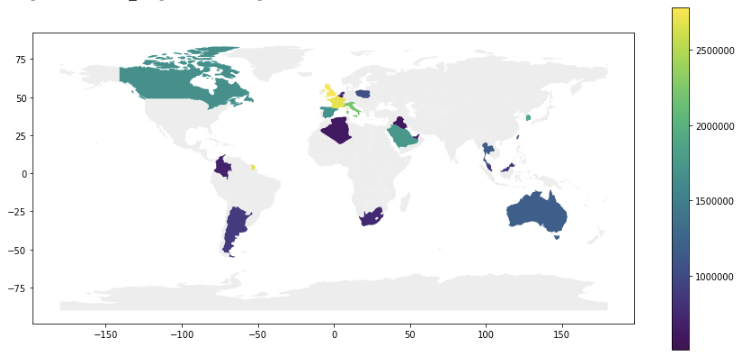
Write a program in main.py that reads in the world dataset shown in an earlier slide and makes a plot of the world highlighting the countries that are “small and rich”. A country is rich if it’s GDP (from the column GDP_MD_EST ) is at least 500,000. A country is small if its population (from the column is POP_EST ) is at most 80,000,000. The plot should show the GDP as the color of each country. Unlike the last problem, you should also plot the entire world map on the same plot but in a light gray (passing in color='#EEEEEE' ) so it’s clearer where these small and rich countries are. The plot should have a legend explaining the colors. Save the plot to a file called small_and_rich.png .
Some notes on your implementation:
Recall that a
GeoDataFrameis just like aDataFrameso you can filter down to just the rows for countries that meet our definition.When creating the figure, please pass in
figsize=(15, 7)to make the result large enough to be legible.Hint: You’ll need to think carefully about how to plot the whole world and the desired countries on the same plot!
The data can be found at
geo_data/ne_110m_admin_0_countries.shp.You should save the result to
small_and_rich.png.Your program should use the main-method pattern and should not use any global variables. Your final result should look like this: