Practice: Plotting 1
Practice: Plotting 1#
In this problem, we will work with the Iris Dataset that looks at various properties of various types of flowers in the iris family. The dataset has the columns
sepal_widthfor the width of the flower’s sepalsepal_lengthfor the length of the flower’s sepalpetal_widthfor the width of the flower’s petalpetal_lengthfor the length of the flower’s petalspeciesfor which species of iris it is (one of'setosa','versicolor', or'virginica').
We have written most of the starter code for you. All you need to do is to fill in some lines of code right after the comments marked TODO .
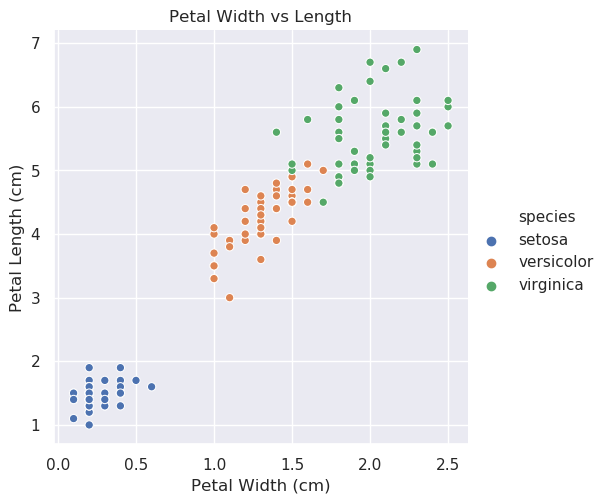
First, make a scatter plot of the dataset stored in df with the petal width on the x-axis and the petal length on the y-axis. You should color the points according to their species. Recall to make a scatter plot, you use sns.relplot . You’ll want to use the hue parameter to specify which column determines the color.
Second, customize the plot using matplotlib to set the following properties
The x-axis should be labeled
Petal Width (cm)The y-axis should be labelled
Petal Length (cm)The title of the graph should be
Petal Width vs Length
There is a new function shown at the end to save the plot as an image in a file. Once you run the program, a file plot.png will be created with the plot you can view (there will be a link at the bottom of the terminal when you run the program)!
Warning
Do not customize the chart in any other way! Part of this test is actually comparing the images so if you add any difference, you might fail the tests!
Your final plot should look like this:

