Tradeoff Between Accuracy and Fairness
Contents
Tradeoff Between Accuracy and Fairness#
Note
Again, most of this slide is based very closely on Michael Kearns and Aaron Roth’s The Ethical Algorithm. They did a fantastic job coming up with an easy-to-approach analogy for the ideas of fairness. I do not want to claim this discussion as my own, since it is heavily based on theirs.
The images in this post are directly from The Ethical Algorithm.
One of the things we alluded to in the last slide was a sort of trade-off between an accurate model and a fair model. When discussing statistical parity, we said that the “perfectly accurate model” (one that always knows the true label) would be considered unfair if the rates of success were different across groups. While this example is not feasible in practice (it’s very rare to ever find a perfect predictor), there is a more general notion of the tradeoff between a model’s accuracy and its fairness.
We again are considering the overly-simplistic and reductive example of college admissions in a world with Circles/Squares. This time, we are going to add one idea in that our decision of college admission will be solely based on the SAT score of each person. This is obviously not how admissions decisions are done in real life, but it’s the simplest analogy we can use to demonstrate our idea.
So our data will be an SAT score for each person (shown as their position on a number line) shown in the image below. For each person, we know their race (Circle/Square), but we will not use that in our decision process explicitly. We also know the true label (successful + or not - based on our definition of success) for all these historical examples. Our goal is to come up with a rule solely based on SAT scores to make the most accurate prediction of success that we can.
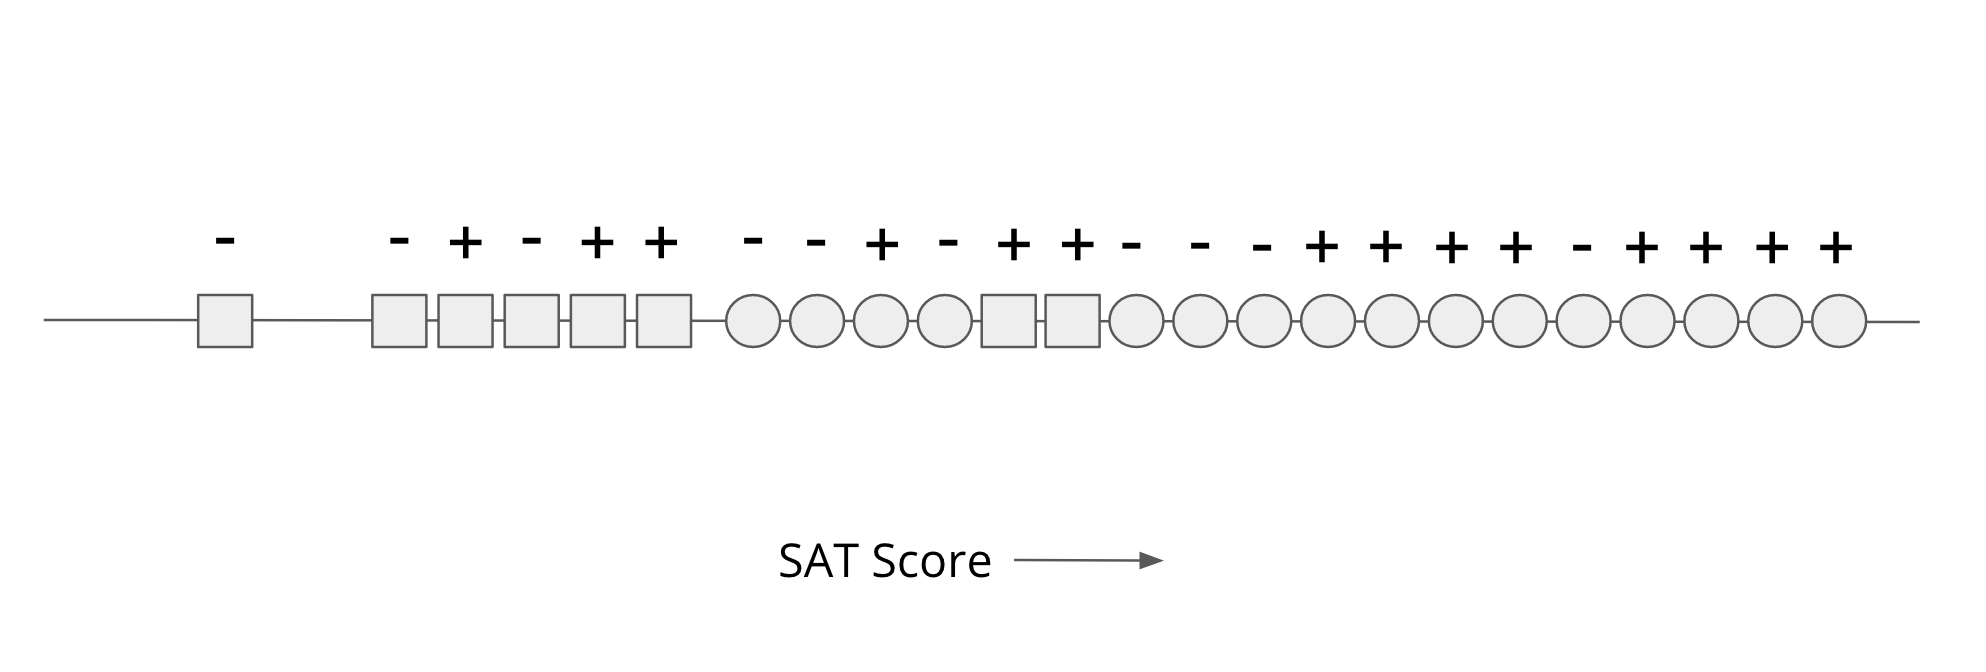
So looking at the picture above, there are three important features of this data to point out:
The majority (2/3) of the data is represented by Circle people while Square people only make up 1/3 of the data.
Even though the population sizes are different, the ratio of each group that is truly “successful” is about the same for each group (9/16 for Circles, 5/8 for Squares).
The SAT scores of Circles tend to be inflated when compared to Squares. It’s hard to ascribe a definitive reason this could be the case, but we discussed similar examples in our lesson last week where systemic factors can create artificial barriers towards equitable treatment for certain groups. It’s entirely possible that the inflated SAT scores for Circles are mostly a result of privilege or it is not salient to actual success in college.
For this simplistic model, we are just going to consider a threshold SAT score and admit all applicants above the threshold. You could imagine the simplest algorithm that just tries every possible SAT score threshold and computes the accuracy for each one. The accuracy would be the number of correct predictions divided by the total number of predictions. A correct prediction is a + to the right of the threshold and a - to the left; a + to the left is a false negative while a - to the right is a false-positive. While we skip trying all possible models, it should hopefully not be too surprising that the “best” threshold is like the image shown below. Using this threshold, the accuracy of the predictions is \(17 / 24 = 70.8\%\) because it made 8 correct + predictions and 9 correct - predictions.
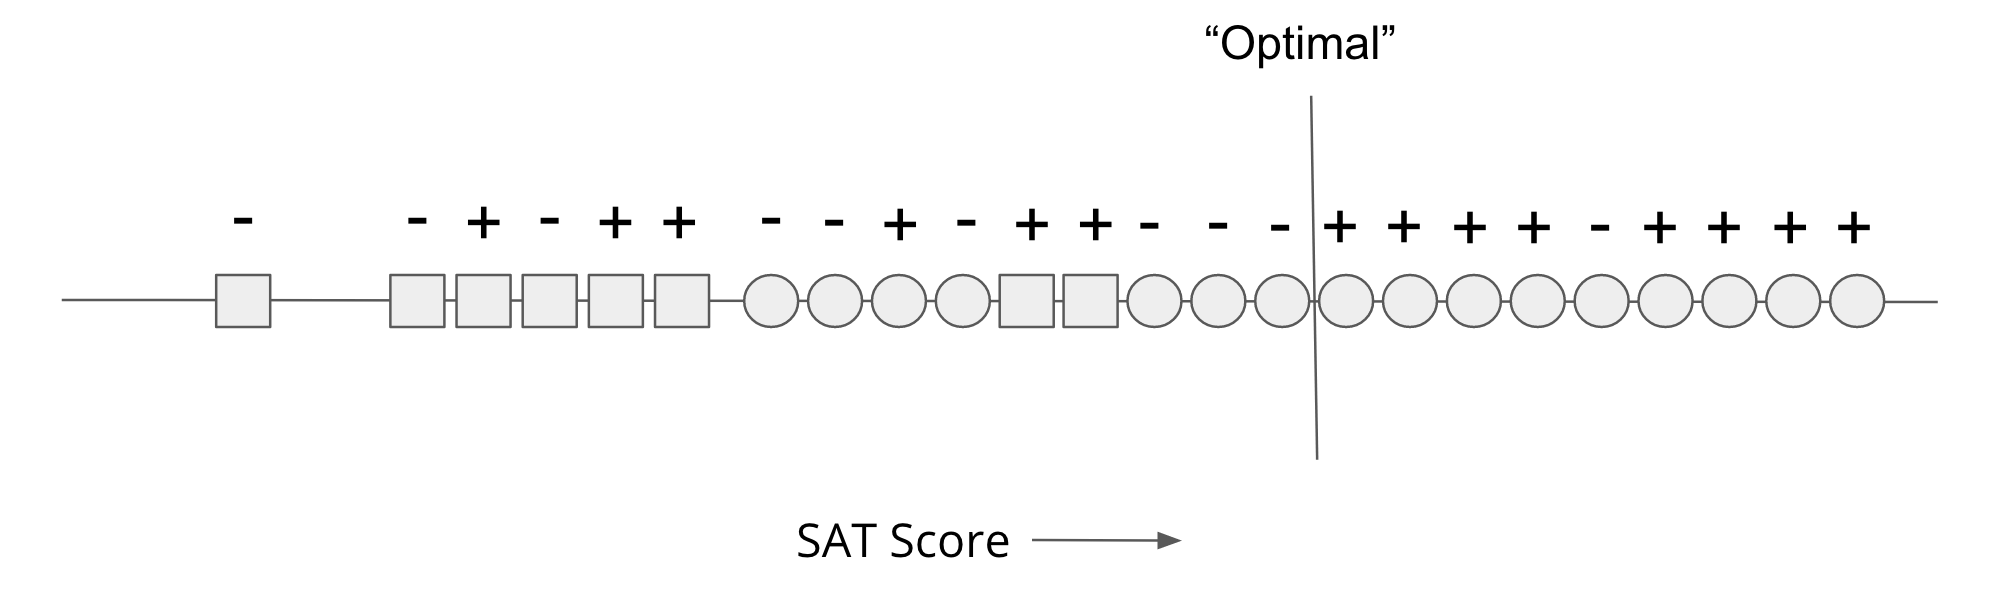
So while this algorithm is the most accurate in terms of the predictions and the true labels, if you look at our fairness definitions, this model seems blatantly unfair. Consider the fairness requirement of equivalence of false negatives (also called equal opportunity). Of the 9 successful Circles, the model makes 1 false negative (a false negative rate of \(1/9 \approx 11.11\%\)) while for 5 successful Squares, the model makes 5 false negatives (a false negative rate of 100%)! This model is blatantly unfair to the Square population since it falsely rejects qualified applicants at a much higher rate.
This extreme disparity in treatment is not necessary for this problem though! If we used a different threshold like in the image below, we could achieve a more fair outcome. The threshold labeled “More fair” in the image below has a false-negative rate of \(1/9 \approx 11.11\%\) for Circles and \(3/5 = 60\%\) for Squares. This model is fairer (using equal opportunity as the definition of fairness) than the other since it achieves closer false-negative rates. However, this model is less accurate than the first model since by moving the threshold to the left, we have now admitted 3 Circles that would not be successful (changing the accuracy to \(16 / 24 \approx 66.67\%\)).
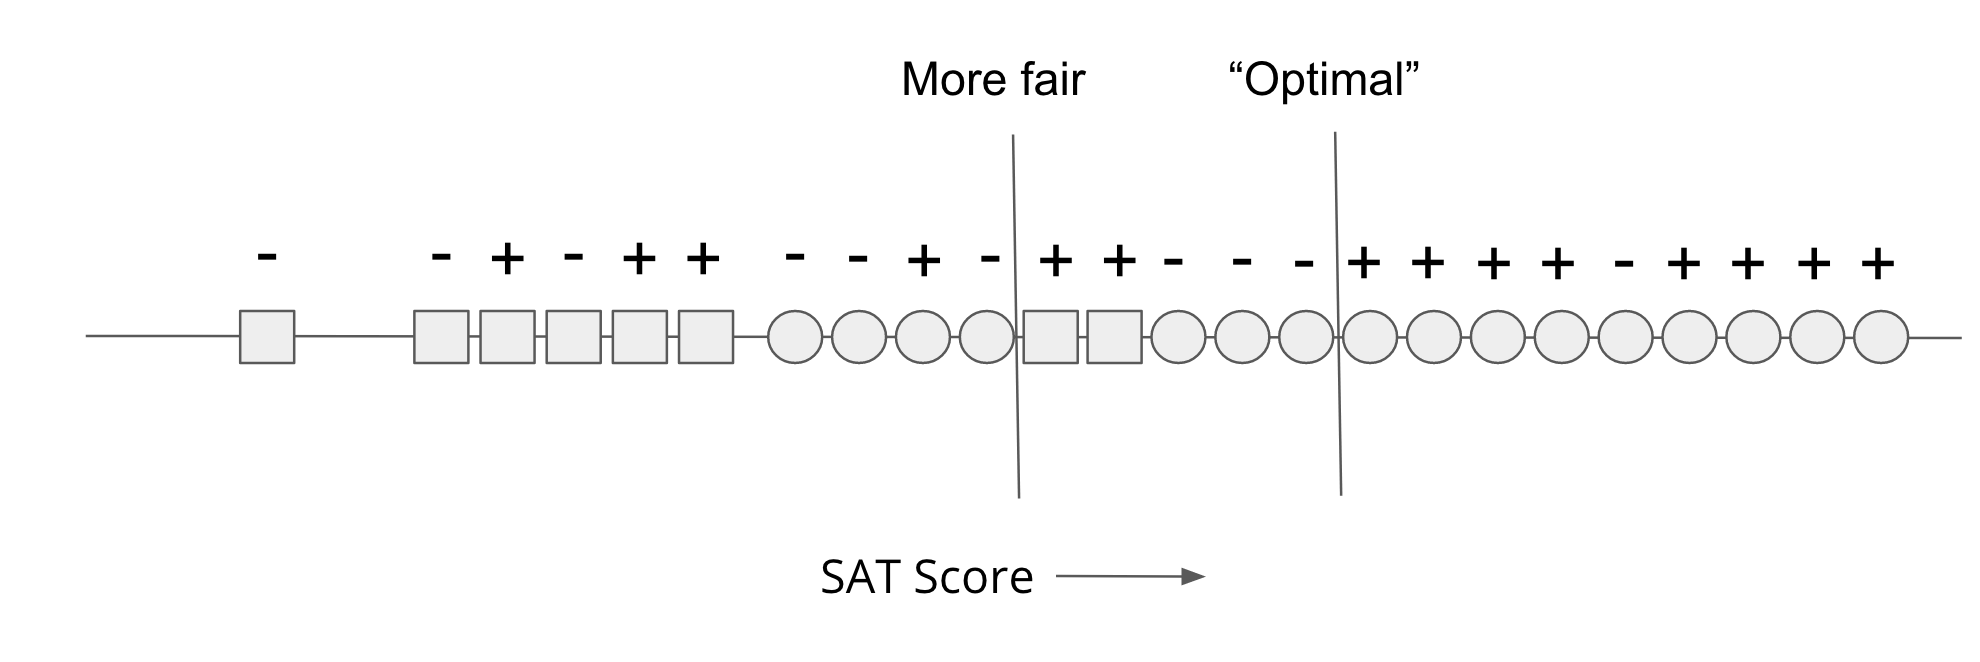
So even in this extremely simplistic model, we have just demonstrated that there seems to be a tradeoff between accuracy and fairness. You might object to this claim since that this may just be a result of the fact this example is overly simplistic. I would argue though that this toy example is a proof of concept, and that in real-world examples that are much more complex, we can only expect things to be worse (e.g, see many examples we pointed out before where there are unintentional consequences from bias in data).
In our original setup of training models to be as accurate as possible, we saw that unfairness could be a byproduct. Any effort we make to improve the fairness will find a model that was not the model we deemed “the most accurate” before, which by definition, would be a less accurate model.
One reason this tension arises is from the fact that our notion of accuracy is tied to data that exhibits this complex difference in distribution between the populations. Accuracy, as defined in this example, will tend towards making a predictor that is more accurate for Circles than Squres since there are simply more Circles in the data; getting it right on them contributes more to the overall accuracy. This might point to the idea that our notion of accuracy is limited. You’re not wrong, but that hasn’t stopped any ML practitioner from defining accuracy on a task!
A second point about where this tradeoff between accuracy and fairness comes from is from the model itself. The model doesn’t account for the fact that the SAT scores of Circles/Squares differ for superficial reasons that don’t impact “success” in college. There are ways to rectify this, but one simple strategy is to have a separate threshold for Circles as we do for Squares. However, by doing so we need to explicitly code race into our model, so it could use that as a feature to prevent unfair outcomes. This causes a problem though since in many contexts, using something like race explicitly is strictly illegal (in Washington, you can’t use race as part of admissions or hiring decisions). These laws can sometimes be there for good intents (to prevent explicit discrimination) but they can also be limiting in preventing “implicit” discrimination reflected in the data we make predictions from. So without this ability to treat the groups separately, we will run into this tradeoff between fairness and accuracy as long as there exist differences between the groups in the data we train on.
Pareto Frontier: Fairness-Accuracy Tradeoffs#
So in the last section, we showed that one model could be very accurate but very unfair while another model can improve fairness for decreased accuracy. Importantly, that discussion never stated which of those models was the right one to use, just that a tradeoff exists between them . You could imagine looking at every possible threshold and each one would operate at a different tradeoff between accuracy and fairness.
In the image below, we visualize this idea of the tradeoff between accuracy and fairness across every possible model. The x-axis of the graph is error (\(1 - accuracy\)) while the y-axis is a measure of “unfairness” (using any fairness definition you want, but a high number means more unfair). Each dot in the graph is a particular threshold and the \((error, unfairness)\) scores that result from using that model. So this picture shows the space of every possible model and the accuracy and fairness that would result from using that model. Again, we aren’t making claims yet of which threshold you should use, just that each one results in a different accuracy and fairness score.
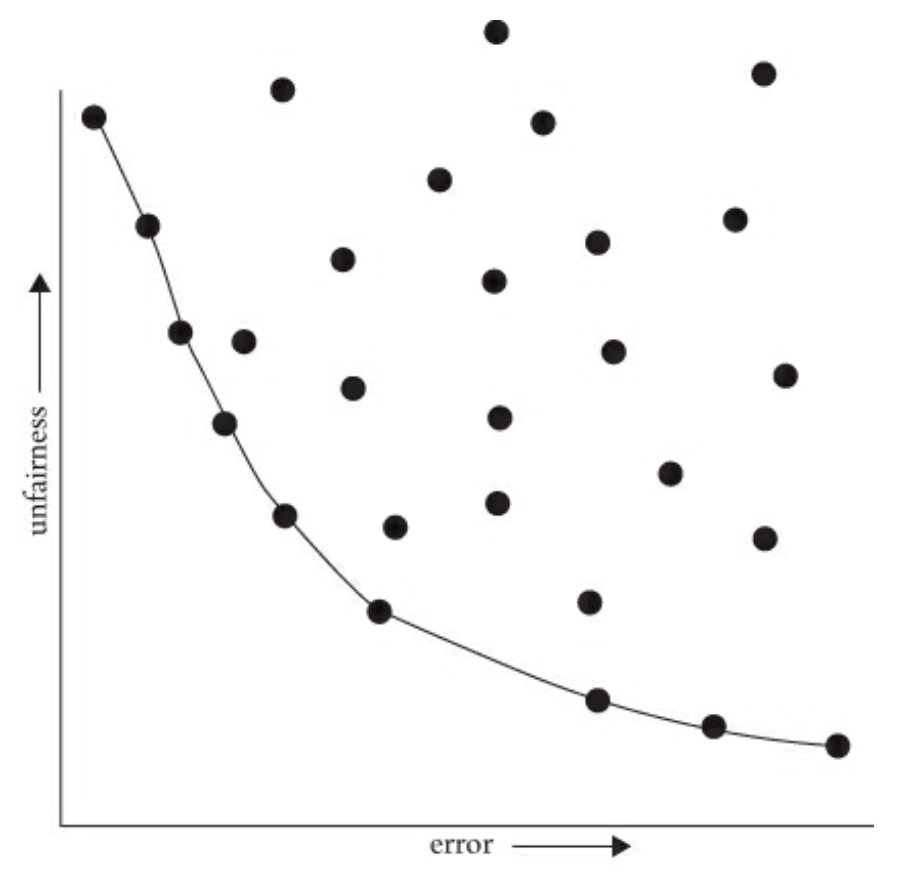
It turns out, that some models are clearly worse than others. While in general, there can be a tradeoff between accuracy and fairness, some models are clearly worse in both. Consider the threshold that results in the top-right point. This model has very high error and very high unfairness. It is clearly worse than:
The bottom-right point that is very inaccurate, but very fair
The top-left point that is very accurate, but very unfair
In general, only a subset of the possible thresholds are actually feasible tradeoffs in this accuracy/fairness space and they are drawn on the curve in the image above. We call this curve the Pareto frontier which is a term from economics that studies tradeoffs. All points off of this curve can be improved in one dimension (fairness or accuracy) without a loss in the other. The points on the curve represent the feasible set of thresholds that have “reasonable” tradeoffs in accuracy and fairness (while the top-right point is just bad since it does a poor job at both).
The Pareto frontier does not say which tradeoff you should choose along its curve. It just represents the set of valid choices. The relative importance of fairness and accuracy depends on the context you are working in and it cannot make that judgment for you. In some sense, it’s just a more quantitative way of reasoning about the tradeoff but does not tell you what the result should be.
I think at first this feels very weird to consider quantitatively looking at the tradeoff between fairness and accuracy. To treat fairness like a number along a curve that we just pick seems at odds with the idea of making something fairer for the people affected by a model. Aaron Roth and Michael Kearns describe this uncomfortable experience quite well, so I’ll leave the commentary to them:
While the idea of considering cold, quantitative trade-offs between accuracy and fairness might make you uncomfortable, the point is that there is simply no escaping the Pareto frontier. Machine learning engineers and policymakers alike can be ignorant of it or refuse to look at it. But once we pick a decision-making model (which might in fact be a human decision-maker), there are only two possibilities. Either that model is not on the Pareto frontier, in which case it’s a “bad” model (since it could be improved in at least one measure without harm in the other), or it is on the frontier, in which case it implicitly commits to a numerical weighting of the relative importance of error and unfairness. Thinking about fairness in less quantitative ways does nothing to change these realities—it only obscures them.
Making the trade-off between accuracy and fairness quantitative does not remove the importance of human judgment, policy, and ethics—it simply focuses them where they are most crucial and useful, which is in deciding exactly which model on the Pareto frontier is best (in addition to choosing the notion of fairness in the first place, and which group or groups merit protection under it, both of which we discuss shortly). Such decisions should be informed by many factors that cannot be made quantitative, including what the societal goal of protecting a particular group is and what is at stake. Most of us would agree that while both racial bias in the ads users are shown online and racial bias in lending decisions are undesirable, the potential harms to individuals in the latter far exceed those in the former. So in choosing a point on the Pareto frontier for a lending algorithm, we might prefer to err strongly on the side of fairness—for example, insisting that the false rejection rate across different racial groups be very nearly equal, even at the cost of reducing bank profits. We’ll make more mistakes this way—both false rejections of creditworthy applicants and loans granted to parties who will default—but those mistakes will not be disproportionately concentrated in any one racial group. Ultimately, this is a callback to the fact that these problems in our models will not be solved entirely algorithmically. While fairness definitions put some mathematical description to fairness, which one you use is ultimately a statement of values which is decidedly a human affair. Far too often, technologists reach towards algorithmic or technical solutions to problems, but it’s very crucial that humans (both the modeler, the modelled, and others) stay in the loop enforcing what shared values we want to uplift.