Practice: Fairness Concepts
Contents
Practice: Fairness Concepts#
Question 0#
Consider the example from the last lesson using cell-phone GPS data to predict whether or not a location has a pothole in it. Which one of the following situations is considered a false negative.
Your Task
Select one option. Write your answer down in your own space.
Option 0
The system predicts there is a pothole at a location, and there truly is a pothole there
Option 1
The system predicts there is a pothole at a location, but there is actually not a pothole there
Option 2
The system predicts there is not a pothole at a location, but there truly is a pothole there
Option 3
The system predicts there is not a pothole at a location, and there truly is not a pothole there
Question 1#
Using the same scenario as the last problem, consider we have the following statistics about pothole detection.
There were 15 locations where our model predicted there was a pothole and there truly was a pothole there.
There were 20 locations where our model predicted there was a pothole but there actually was not a pothole there.
There were 30 locations where our model predicted there was not a pothole but there truly was a pothole there.
There are 5 locations where our model predicted there was not a pothole and there truly was not a pothole there.
What is the False Negative Rate of this model? Write your answer as a number between 0 and 1 rounded to two decimal places (e.g., 0.25 ).
Your Task
Write your answer down in your own space.
Question 2#
Consider a task similar to the lesson of predicting college admissions in a world with the Circle/Square races. Suppose we have the following dataset below where each person is on the numberline based on their SAT score, with their true label being shown above their symbol ( [S] means square and (C) means circle, + means positive label and - means negative). The vertical line shows a classifier we are going to analyze.
                                        |
 -   -   -   -   +   +   -   -   -   +  |  +   -   +   +   +
(C) (C) [S] (C) [S] (C) [S] (C) (C) [S] | [S] (C) [S] (C) [S]
                                        |
                                        |
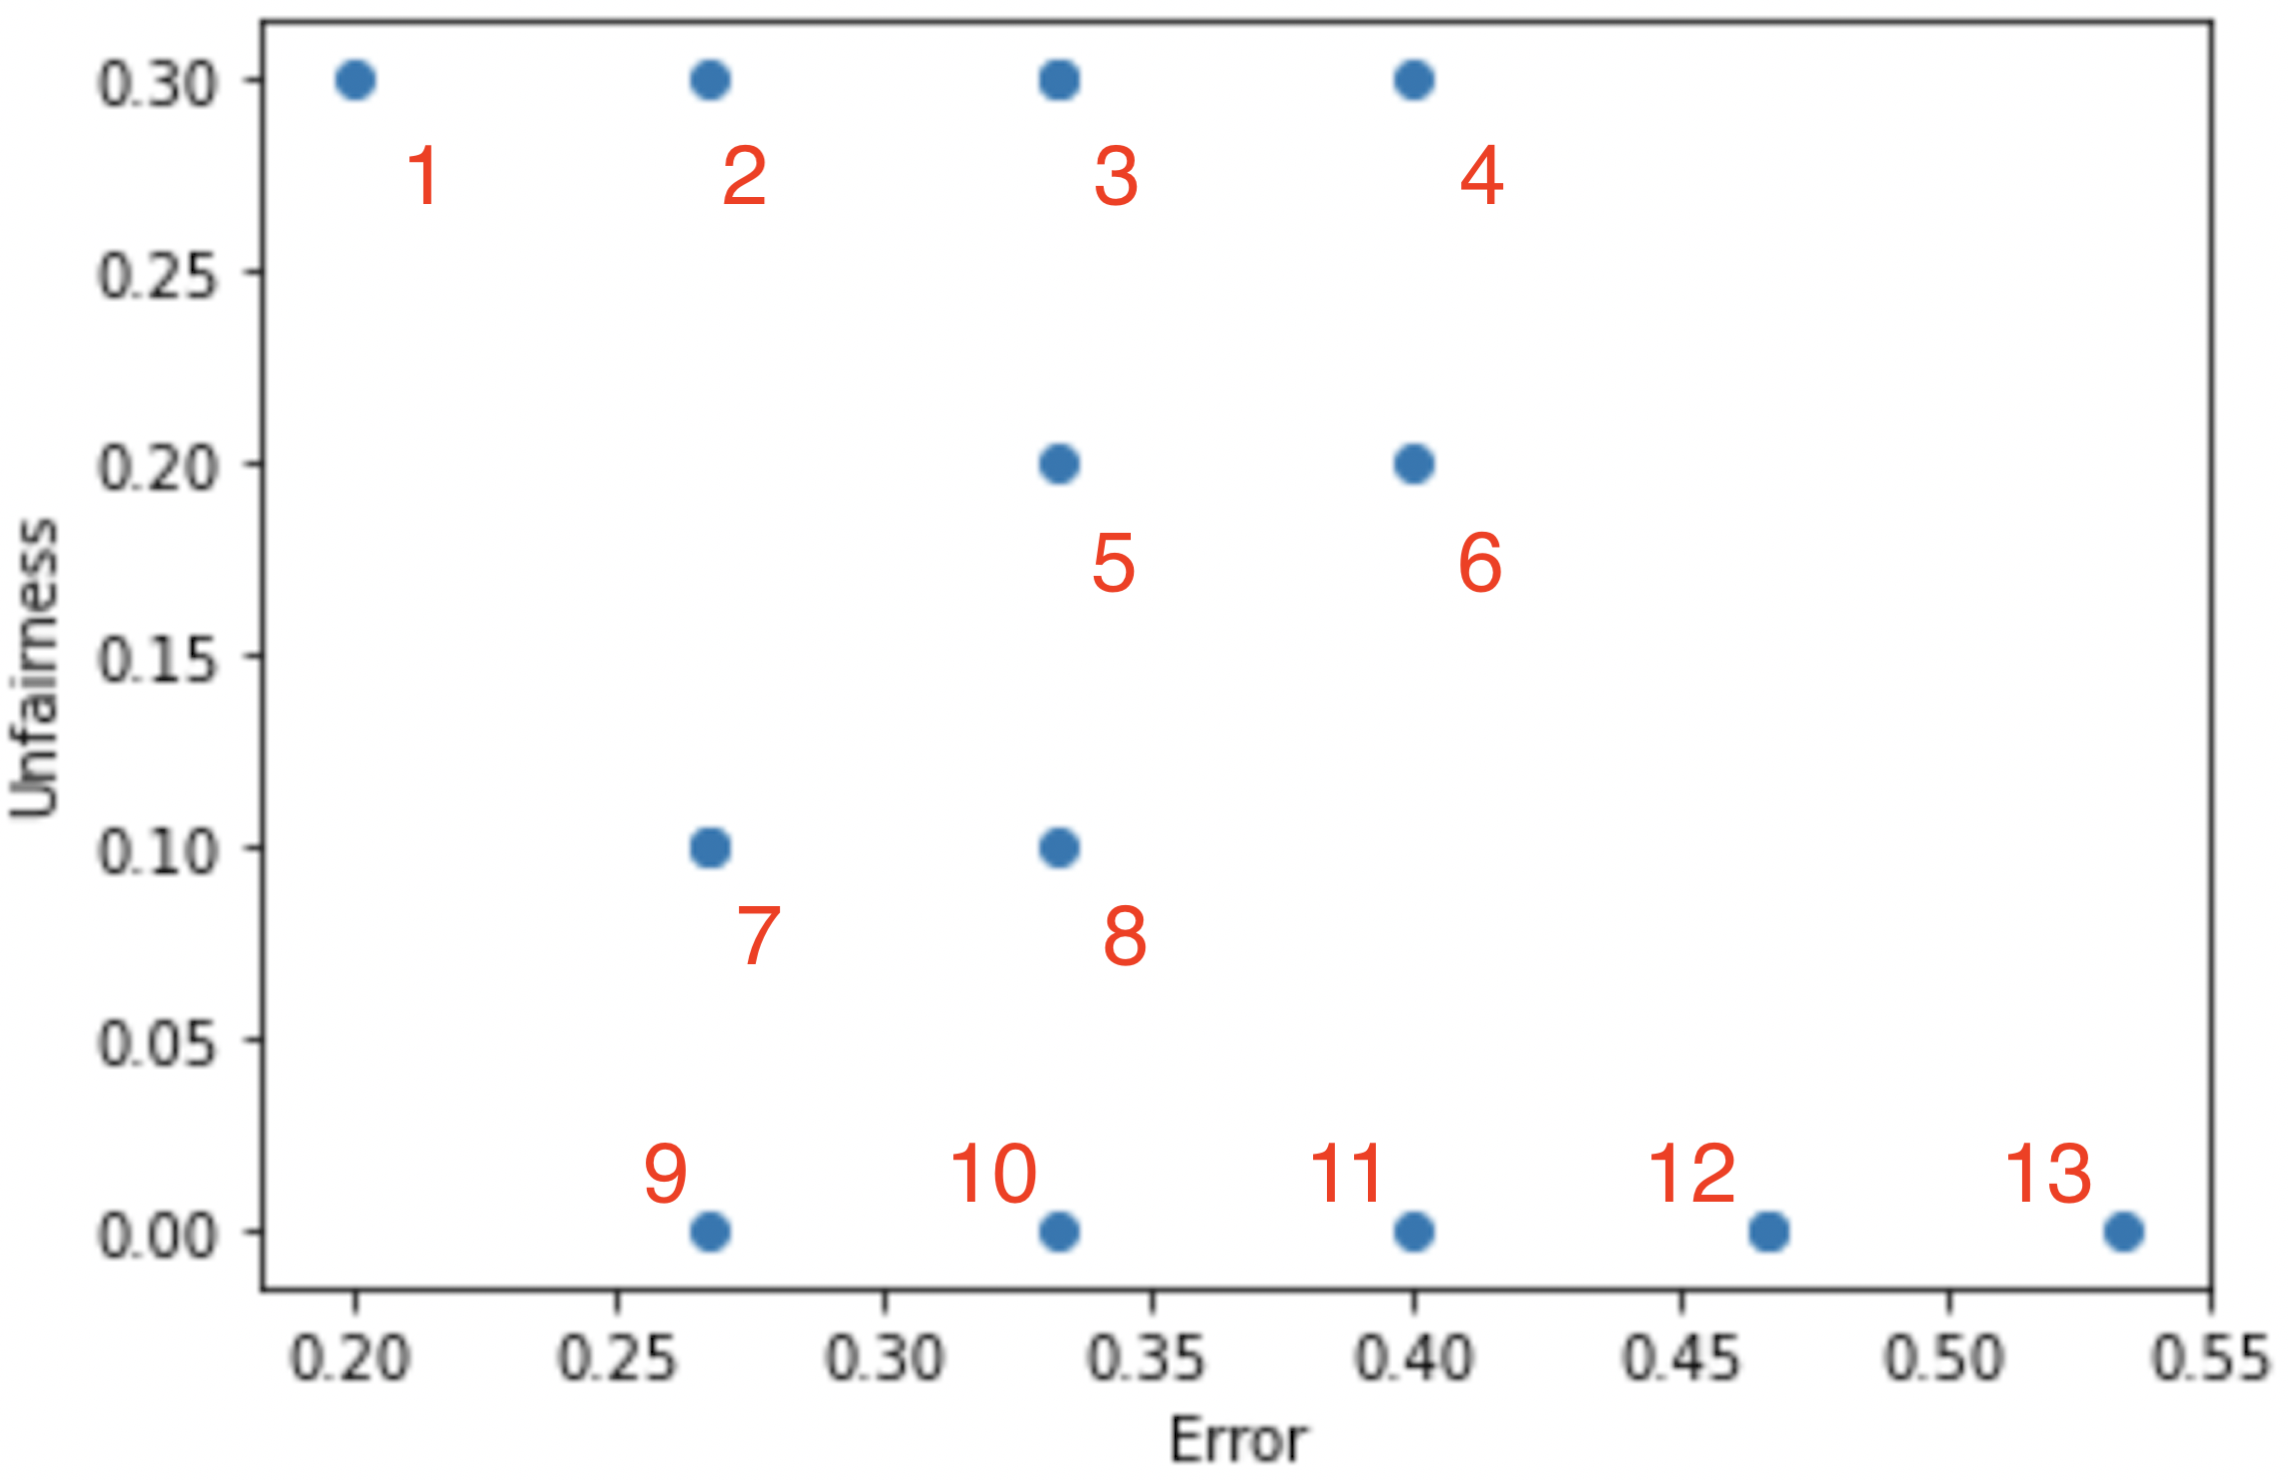
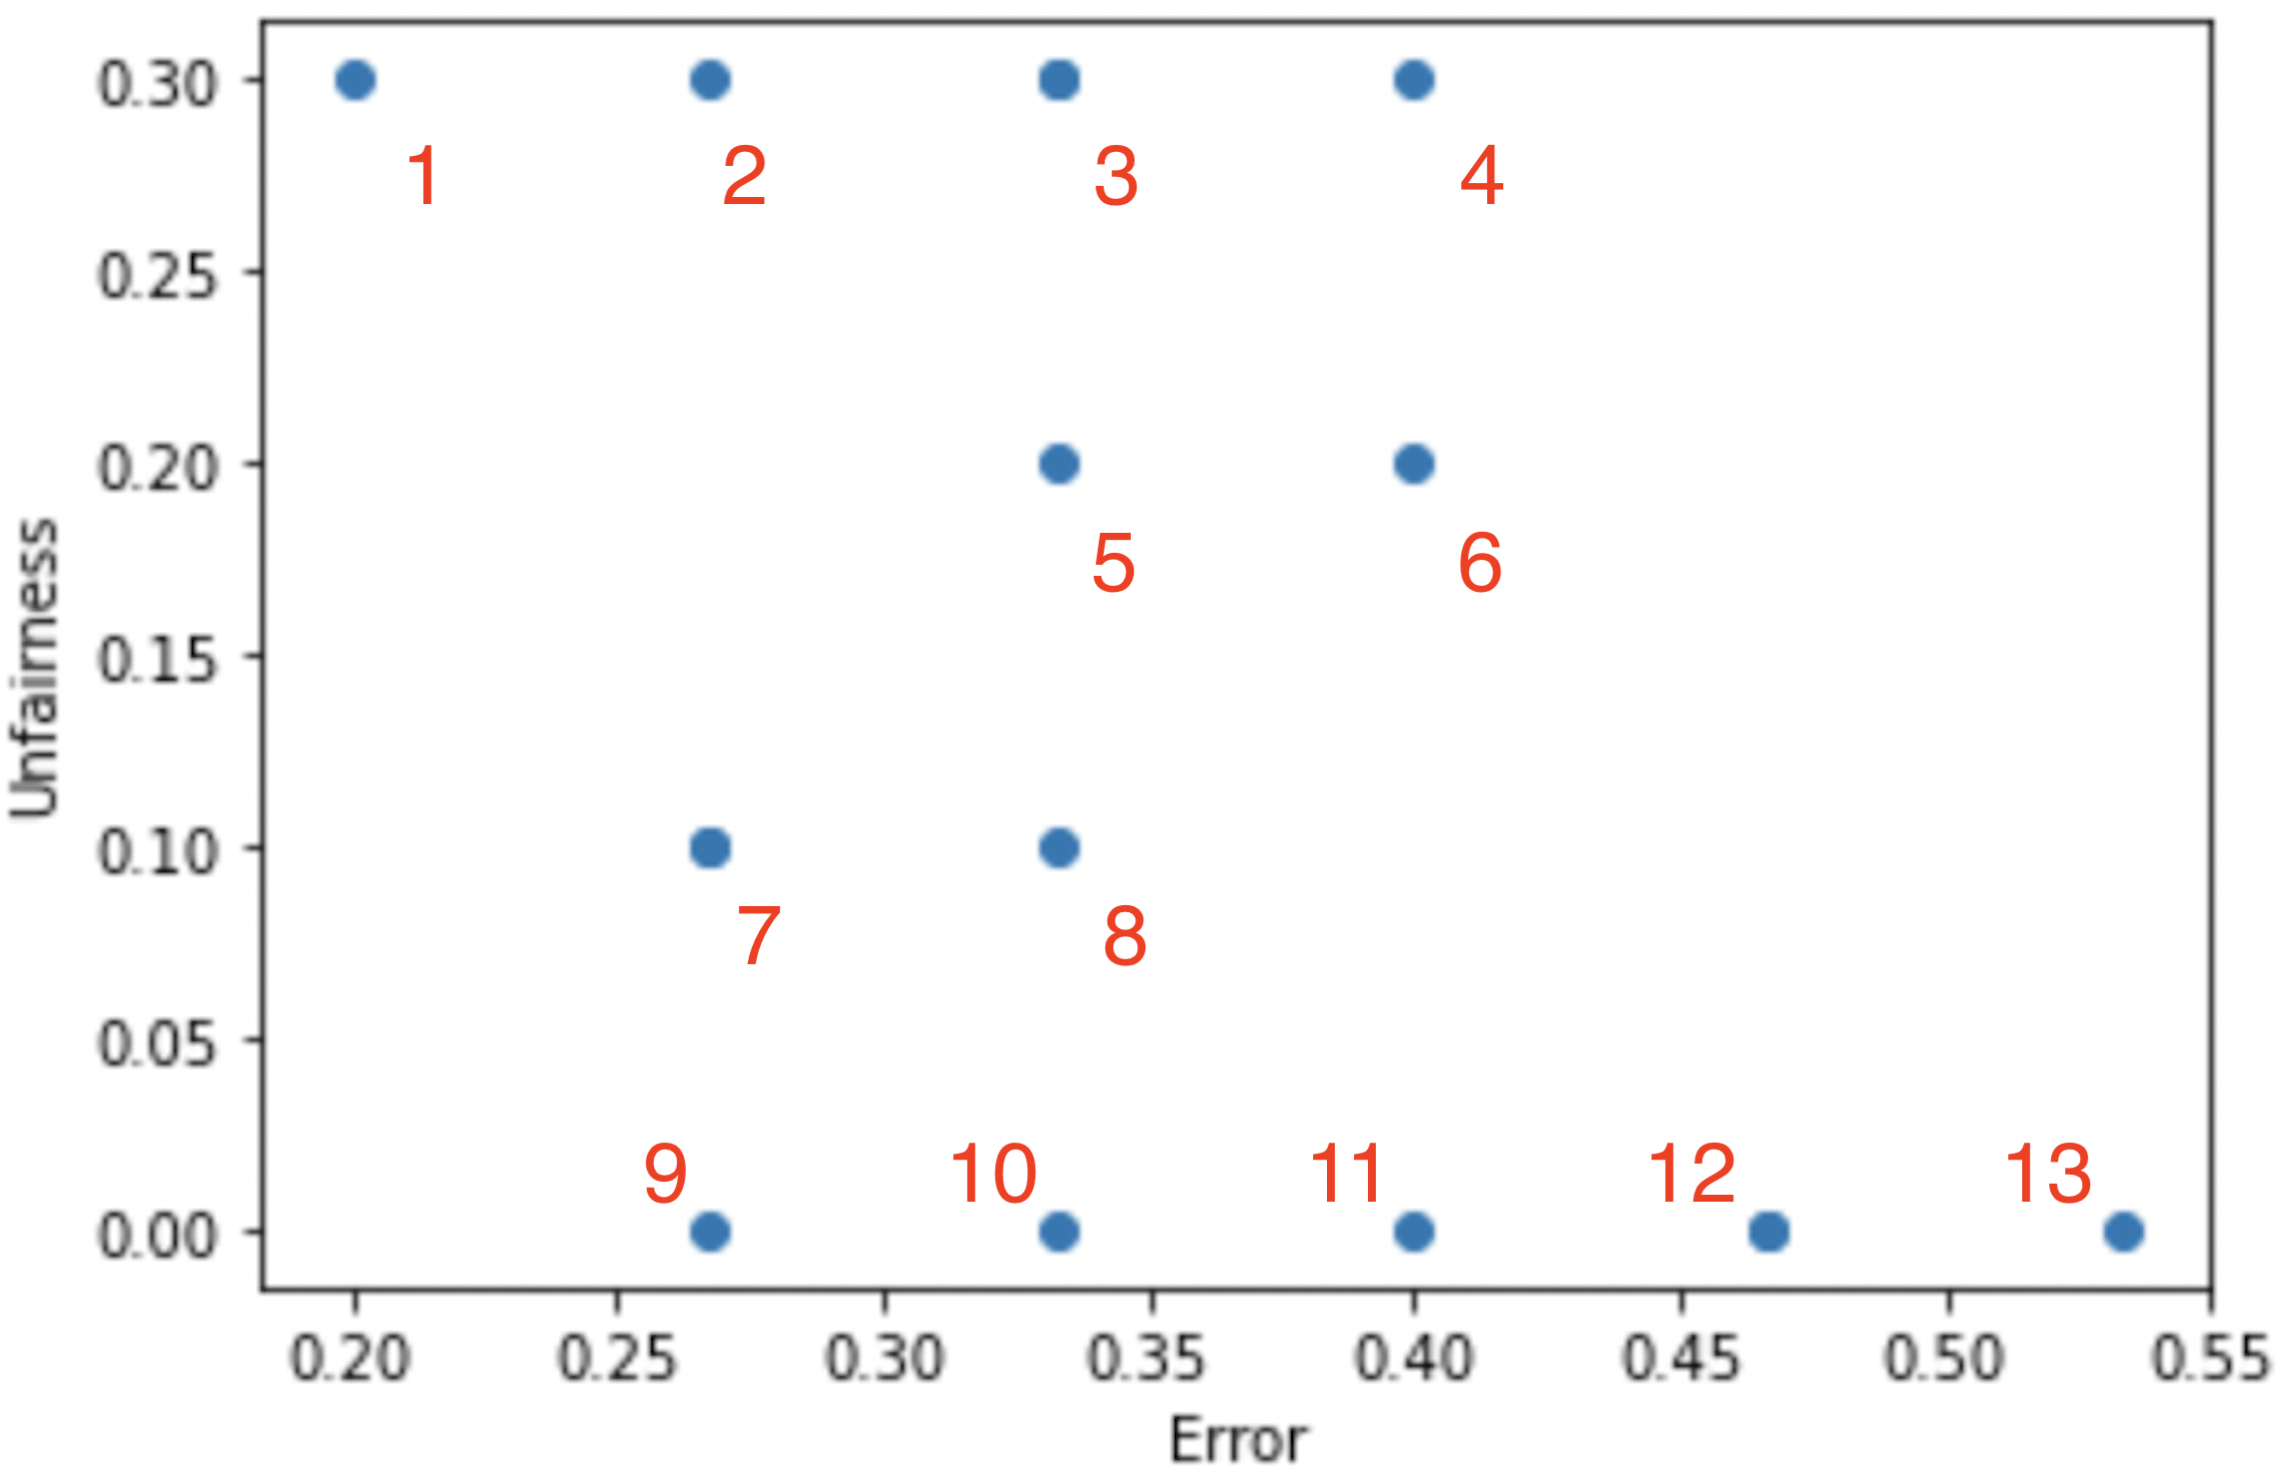
In the image below we show the \((error, unfairness)\) score for every possible threshold that could exist for this data. We define the error of the model as
In the lesson we defined a few notions of fairness. Commonly we try to plot out how “unfair” a model is by looking at differences in fairness metrics across subgroups. So for this example, define unfairness as
where \(|x|\) is the absolute value function, \(Circle\ FNR\) is the false negative rate when only looking at Circles and \(Square\ FNR\) is the analog for Squares.

Your task is to identify which point on this accuracy/fairness tradeoff corresponds to the threshold in the image above. Each point is labeled with a number in a picture. Pick which number is associated with the threshold shown above.
Your Task
Select one option. Write your answer down in your own space.
Option 0
1
Option 1
2
Option 2
3
Option 3
4
Option 4
5
Option 5
6
Option 6
7
Option 7
8
Option 8
9
Option 9
10
Option 10
11
Option 11
12
Option 12
13
Question 3#
Using the same plot of possible tradeoffs, between error and unfairness, select which numbered points are on the Pareto frontier. Select all points that apply.

Your Task
Select one or more options. Write your answer down in your own space.
Option 0
1
Option 1
2
Option 2
3
Option 3
4
Option 4
5
Option 5
6
Option 6
7
Option 7
8
Option 8
9
Option 9
10
Option 10
11
Option 11
12
Option 12
13
Question 4#
True or false: The Pareto Frontier tells you which point is the correct tradeoff between fairness and accuracy.
Your Task
Write your answer down in your own space.
Question 5#
Last time, we talked about the COMPAS model for predicting recidivism rates. One of the concerns we discussed with the model in the reading was the model reflecting the structural racism in our society and the model was reflecting that bias in its decisions.
Which worldview would you be using to come to this conclusion about the model? Select the best option available.
Your Task
Select one option. Write your answer down in your own space.
Option 0
What You See is What You Get (WYSIWYG)
Option 1
Structural Bias + We’re All Equal (WAE)
Option 2
Not enough info to tell
