Defining Fairness
Contents
Defining Fairness#
Note
Again, most of this slide is based very closely on Micael Kearns and Aaron Roth’s The Ethical Algorithm . They did a fantastic job coming up with an easy-to-approach analogy for the ideas of fairness. I do not want to claim this discussion as my own, since it is heavily based on theirs.
What does it mean for an algorithm to be fair? How can we come up with a definition of what makes a decision fair and what makes a decision unfair? It turns out there are many different ways to define fairness, each definition taking its own stance on what is or is not “fair”. We’ll see that many of these definitions can be useful in different contexts, but don’t always agree. Different definitions might conflict with others, so it’s not likely we will be able to settle on one universal definition of fairness.
In this first part of the lesson, we will particularly be talking about the notion of group fairness which is an attempt to define a measurement of how fair a process is, in order to avoid discrimination against a particular subgroup. These subgroups are commonly thought of as being defined by race or sex, but they can be broadly defined to capture concepts like religious or political identity, different abilities, or any intersection of these traits. Usually (but not always) a subgroup is defined based on a characteristic that someone has no control over. A key goal in a system is to avoid discrimination based on membership in one of these protected groups, as to avoid them being treated unfairly due to factors outside of their control. In other words, we don’t want someone’s membership or lack thereof in this subgroup to have a negative impact on our decision making process.
In this lesson, we will be focusing on a rather narrow and simplistic example a situation where we want to ensure fairness. This simplification is presented so we can better understand the core arguments of what is or is not fair in this scenario, it is not a reflection of how the world actually works. However, most of the ideas we will talk about in this lesson extend quite naturally to real-world subgroups we might care to avoid discriminating against certain groups. Please forgive the overly simple assumptions we make since they are there to make this discussion tractable; the assumptions are not an indication of how we think the world actually is. The point of showing that things can go wrong with even simple, contrived examples is to highlight that in real life where things are more complex and multi-faceted, things are likely to go even more wrong.
Scenario: College Admissions#
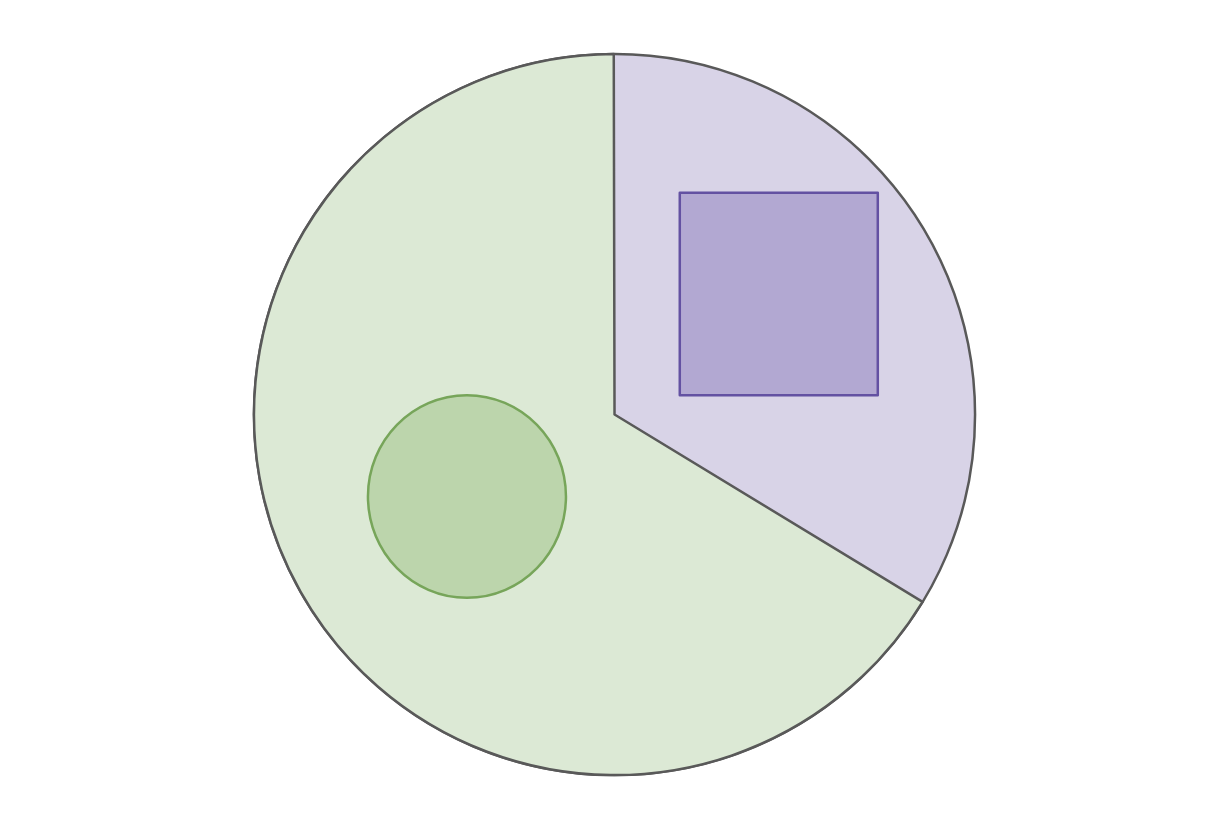
Suppose for the sake of simplicity, we are considering an alternate Earth inhabited by people that belong to one of two races: Circles and Squares. Circles make up about 2/3 of the population (a majority), which leaves the Squares to be 1/3 of the population (a minority). Our example today will be focusing on a process for deciding on college admissions, and talking about how to define fairness to prevent discrimination against either group: Circles or Squares.
For this example, we will ultimately try to train a model that can make decisions about college admissions. It’s not infeasible to imagine an admissions committee trying to rely on an algorithm to help them decide. They might think relying on an algorithm can remove human bias, thus improving outcomes for their students. We’ll come back to the idea of if an algorithmic solution will actually guarantee a lack of bias.
If we want to model college admissions, we likely need to have some definition of what students we want to admit. We will assume we have some historical data on who was “successful” in college and try to make predictions about new students having that success. This example can be agnostic to how you define success (e.g., it could be just graduating, or getting a job after college, or donating a bunch of money to UW after graduating) but we assume we are working with some definition of success for our future applicants, and we don’t know that true label yet.
A first attempt: “Shape-blind”#
If our goal is to prevent discrimination against either race, you might imagine the simplest thing you can do is to make sure your decision process is agnostic to an individual’s race. This is often called a “blind” approach since you remove the demographic variable you don’t want the algorithm to accidentally discriminate on. The thought is that it is impossible to discriminate if your process isn’t able to look at the features you want to protect.
Unfortunately, the reality isn’t always so simple. Last time, we talked about the COMPAS algorithm having discriminatory outputs for recidivism based on race, even though the model itself had no direct input telling it someone’s race. This is because race and many other factors about you can be fairly accurately inferred using others. We are actually very familiar with this idea that properties of our identity can be inferred from others when we experience internet ads every day on the internet. The whole system of targeted advertisements is predicated on the ability to make inferences about your interests while only having access to correlations that are provided by your other interactions on websites (e.g., if you started searching for a crib for a baby on Amazon, you are more likely to be expecting a child).
It turns out that approaches that try to constrain the inputs to a process or an algorithm tend to not work well in practice since so much can be inferred from the other wealth of data about you. Instead, a common practice for defining fairness is on the outputs or decisions of the process/algorithm rather than restriction of the inputs. In the following sections, we will define some possible ways to define fairness based on the outputs of our college admissions model.
Fairness Definition 1: Statistical Parity#
The first, fairly natural, definition of fairness we will discuss is called statistical parity. As a reminder, we are in the running example of trying to determine college admissions (a admit/deny decision) on a population of people that fall into one of two races (Circle or Square). Statistical parity in this setting says:
The fraction of all the Squares that are admitted to college matches the fraction of all Circles that are admitted to college. For example, if we let in 30% of the Circle population into our college, to meet statistical parity, we would also need to let in 30% of the Square population. That’s it! Nothing really fancy in this definition. However, it turns out statistical parity ends up being a rather weak definition of fairness.
We’ll see that this definition of fairness says nothing about which Circles/Squares get admitted or that true label of “success”. You could admit a completely random subset of the population to meet statistical parity, regardless of how successful each might actually be. This may or may not actually be a bad example based on how you assume the world works (e.g., you might believe every person can succeed, so random sampling is appropriate), but since you are doing an admissions process in the first place you probably have some belief that there is a fair way that you might be able to determine success. It seems rather weak that you can achieve fairness using this definition by just randomly picking people.
The second, more subtle challenge with statistical parity, is the scenario in which the distribution of which people are “successful” is not the same across the Circle/Square groups. So just for the sake of example, suppose 30% of the Circles are “successful” and therefore should be admitted while only 15% of the Squares are. This should be a very questionable assumption for the sake of example (saying one race is more/less qualified), but this is not something that is unthinkable in real-world data:
It’s entirely possible that one group had less equitable access to college preparation, and therefore has a harder time meeting the definition of “success” (e.g., graduating). This is no fault of the group on its own but is a trend that can be reflected in the data. We are working here from historical data to make predictions about the future, so it’s possible that bias in the data can make this notion of fairness difficult and we should take every step possible to combat that bias.
It’s also possible that there should be differences between the groups. It’s probably a bit hard to conceptualize this in an example of college admissions, where, in real-life college is very closely tied with the ability to succeed socio-economically in life. But you could imagine a scenario in which the thing you are trying to predict (e.g., this definition of “success”) can be different across groups since different groups can have different sets of values. For example, maybe the Circles over-value the role of college in life so there is more familiar pressure for Circles to attend college, inflating the historical count of “success” for that group. Again, this is just a made-up example that may not reflect real life, but it’s not unthinkable that there can be differences under some contexts.
When these differences in the data exist, statistical parity puts you in a really tough position. Even if you had a “perfect predictor” that could 100% predict success, you wouldn’t be able to let in the 30% of Circles and 15% of Squares. That would violate statistical parity even though your predictions were perfect! This then forces you to make the choice:
Wrongly deny 15% of the Circles that would have been successful to match the 15% rate in Squares.
Wrongly admit 15% of the Squares that would not have been successful to match the 30% rate in the Circles.
Both of these choices seem less than desirable (but which one is worse depends on the context you are working in). So to fix this, we need to look into slightly more complex examples of fairness.
Fairness Definition 2: Equal Opportunity#
One rather simple fix to the idea of statistical parity is to look at the rates of the mistakes we make in admission rather than the rate of admissions themselves. So instead of looking at what percent of Circles/Squares we admit, we could look at what percent of Circles/Squares we wrongfully reject. A wrongful rejection is someone who truly would be successful, but we denied admission which we often call a false negative in the terminology of classification. A false negative is when we predicted a negative result (e.g., “not successful”) when the true label was positive.
Commonly, we refer to the false-negative rate as the ratio of examples that are truly positive that got falsely labeled as negatives. So mathematically, the false-negative rate is
So for example, if 5 people would truly be successful in college, and 2 of them we predicted a deny status, the FNR would be 0.4.
Our second definition of fairness is called equal opportunity and it requires equality of false-negative rate of our admissions decisions. In other words, the percent of the population that would truly be successful that was rejected needs to be the same across groups. This definition of fairness controls for the mistakes made against those that ultimately would have succeeded.
The intuition here is we want to prevent one group from being unfairly rejected more frequently than another. Again, a false negative happens when you truly would have been successful, but our admission decision said that you would not. In other words, all else being equal, your race (Circle/Square) should have no impact on the probability our admission decision harms you.
In practice, it might be hard to require exact equality, so this requirement of equal opportunity is often phrased as the false-negative rates being very close (e.g, maybe within 1%). This is generally just a limitation of how numbers work in the real world, where we have finite samples so there might be some small variation in the statistics just by chance (e.g., if the denominators are different numbers).
This definition of fairness is generally better than statistical parity but still might not feel exactly right to you. Under the definition of equal opportunity, if our model accidentally rejects 20% of the Squares who were truly “successful” then our model is considered fair as long as it also accidentally rejects 20% of the Circles who were truly “successful”. That probably doesn’t sound “fair” to you, if you were one of those rejected Squares! It probably doesn’t make you feel better that your rejection is considered fair by our definition since an equal proportion of Circles were also wrongly denied!
This is actually a key point to highlight, both definitions we have shown so far (statistical parity, and equal opportunity) are notions of group fairness . They are mathematical definitions to spot potential discrimination against a particular protected group but say nothing about fairness when it comes to discussing individuals within those groups. We’ll talk more about this tension between group fairness and individual fairness in our last slide of the lesson today.
Fairness Definition 3: Predictive Equality#
We will briefly mention that there is another definition of fairness called predictive equality that focuses on the other type of mistake possible, called a false-positive . A false positive occurs in our college admissions example when we admit (making a positive prediction) on an applicant who would ultimately not be “successful”.
Which type of mistake, a false-positive or a false-negative, is worse overall depends on the context you are working in. You have to think carefully about the relative harm caused by a false-negative vs. a false-positive and you usually want to make sure you provide equality in the one with more potential for harm. Pretty much everything we discussed in the last section on equal opportunity applies to predictive equality as well.
More Definitions of Fairness#
It turns out, there is a myriad of mathematical functions to attempt to define what fairness means. Many of them share the form of the examples we have shown far, that require some statistical similarity when looking at decisions made across groups. We are in no position to outline them all, but there are a lot. What we will see though, is that there is no universal definition of fairness. Each definition makes assumptions about how we think the world should work and what outcomes are fair.
This wealth of definitions of fairness is actually a good thing, not a bad one! This just serves as a reminder that there is a crucial role that people must play in the design and use of models. Since there isn’t just a “one and done” definition of what we mean by “fair”, we have to work together in our context to critically examine what we value and collectively decide on what values our system should uphold. This emphasizes the role of people (e.g., policymakers, regulators, philosophers) in this decision-making process and that it’s very unlikely that our solution to fixing problems will be purely algorithmic in nature.
In the next slide, we will explore a notion we did not bring up in this one about the tradeoff between fairness and accuracy, and then we will briefly highlight a generalized statement of worldviews that can help you reason about fairness.