Practice: Plotting 2
Contents
Practice: Plotting 2#
In this problem, we will work with the same iris dataset, but this time the dataset contains some missing values. As a reminder, the dataset has the columns
sepal_widthfor the width of the flower’s sepalsepal_lengthfor the length of the flower’s sepalpetal_widthfor the width of the flower’s petalpetal_lengthfor the length of the flower’s petalspeciesfor which species of iris it is (one of'setosa','versicolor', or'virginica').
For this problem, we have provided no starter code so you will need to recreate it from the last problem! The dataset is stored in iris_missing.csv.
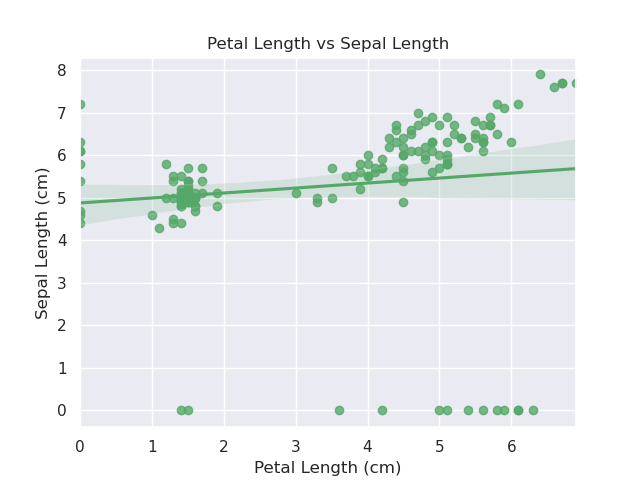
First, make a regression plot of the dataset stored in df with the petal length on the x-axis and the sepal length on the y-axis. The color of the points and the line should be green (use code 'g' )! Any rows with missing values should be given a value of 0. Look back at the lesson to identify which functions you can use to help you make this plot.
Second, customize the plot using matplotlib to set the following properties
The x-axis should be labeled
Petal Length (cm)The y-axis should be labeled
Sepal Length (cm)The title of the graph should be
Petal Length vs Sepal Length
Save your image to plot.png . Remember you will need to pass that extra parameter to make the layout tight.
Warning
Do not customize the chart in any other way! Part of this test is actually comparing the images so if you add any difference, you might fail the tests!
Your final plot should look like this:

seaborn functions#
For convenience, we will put the functions you’ll want to select from seaborn here.
