Practice: Population in South America
Practice: Population in South America#
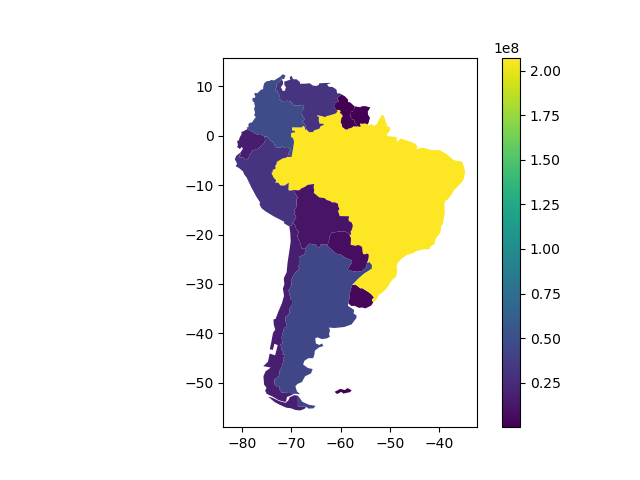
Write a program in main.py that reads in the world dataset shown in an earlier slide and makes a plot of just the countries in South America colored by their population (using the column 'POP_EST' ). The plot should have a legend explaining the colors. Save the plot to a file called south_america.png .
Some notes on your implementation:
Recall that a
GeoDataFrameis just like aDataFrameso you can filter down to just the rows for countries in South America (where the'CONTINENT'column has value'South America').The data can be found at
geo_data/ne_110m_admin_0_countries.shp.You should save the result to
south_america.png.Your program should use the main-method pattern and should not use any global variables. Your final result should look like this: